Statistics & Probability
Working With Data
Monday 21st November
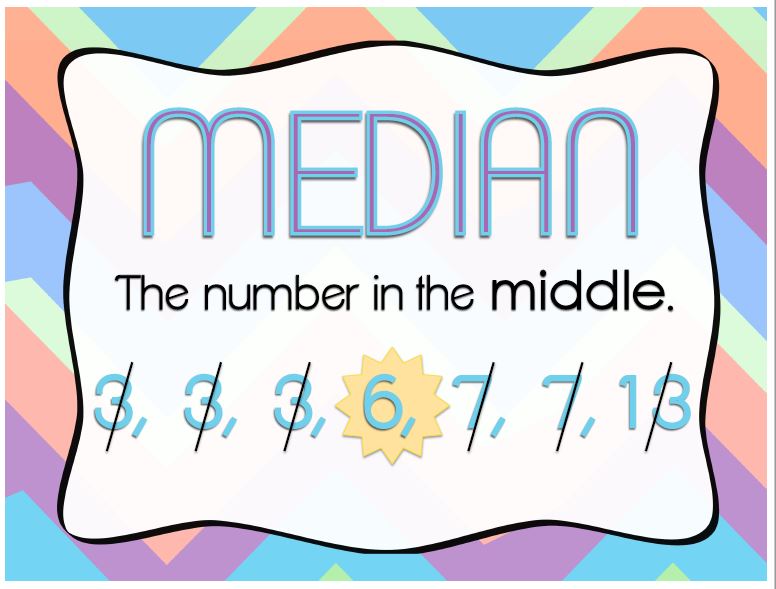
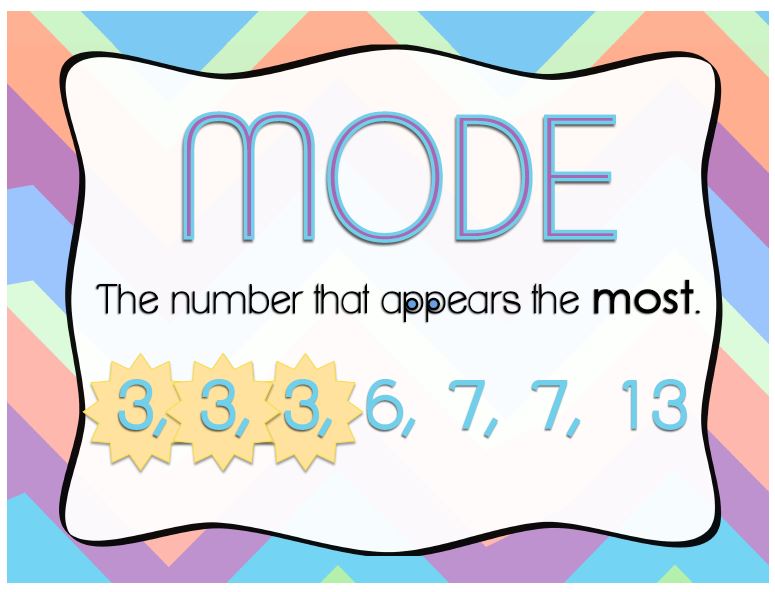
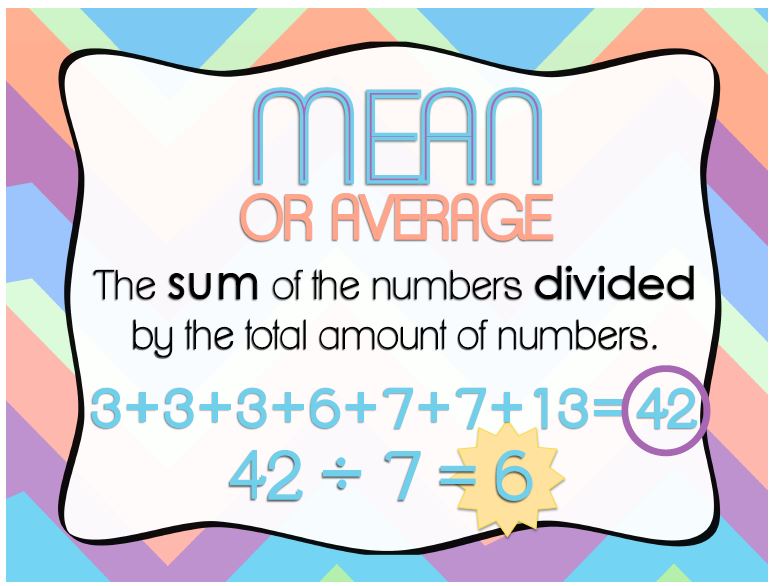
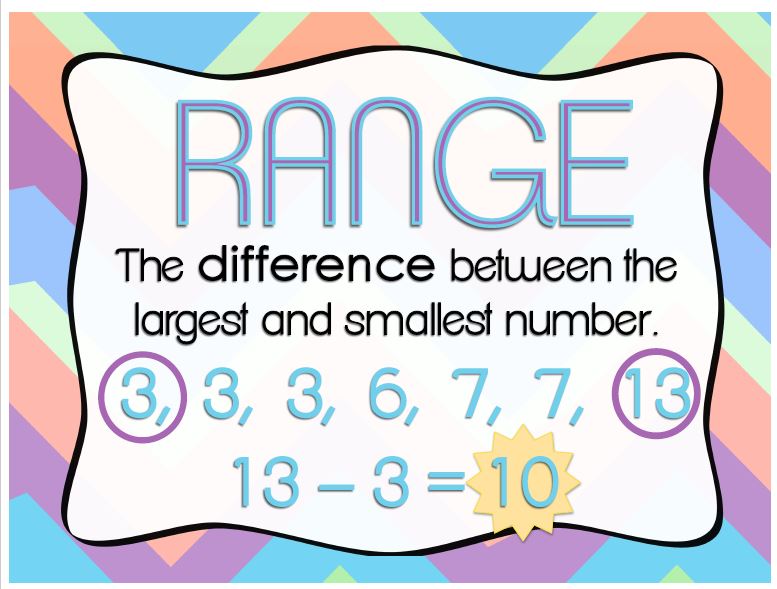
Learning Intention: We are learning to calculate mean, median, mode and range for sets of data.
Warm Up: Reading Graphs Kahoot
Learning Intention: We are learning to calculate mean, median, mode and range for sets of data.
Warm Up: Reading Graphs Kahoot

|
|


Co-operative Learning Group Challenge: How many cups can you stack in one minute?
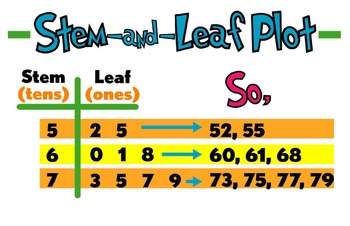
Complete the challenge, then we will interpret the class's data together by first making a stem and leaf plot to show the results, and then calculating the mean, median, mode and range.
Then: In your group, you will each have a turn to individually stack the cups (in one minute). Collect the data in your group, make a stem and leaf plot to show the results, then calculate the mean, median, mode and range.
Wednesday 23rd November
Learning Intention: We are learning to calculate mean, median, mode and range for sets of data.
Group 1: With Miss Brown. Calculate the mean, median, mode and range of the following four sets of data:
Learning Intention: We are learning to calculate mean, median, mode and range for sets of data.
Group 1: With Miss Brown. Calculate the mean, median, mode and range of the following four sets of data:

Group 2: Solve the following problems in order to complete the printed colouring sheet.
Exploring Data Displays
Monday 14th November:
Learning Intention: We are learning to describe and interpret different sets of data
Learning Intention: We are learning to describe and interpret different sets of data
In your co-operative learning group, analyse your example of a data display. Use the resources below (as well as the foldable you made last week) to help you.
Work together to complete your graphic organiser, including:
Be prepared to share back with the whole class.
Work together to complete your graphic organiser, including:
- What kind of data display it is.
- The essential features of this type of data display.
- What type of data can be shown in this format.
- Three questions to ask the class, relating to the data on your sheet. You must know the answers - but don't write them on your sheet!
Be prepared to share back with the whole class.
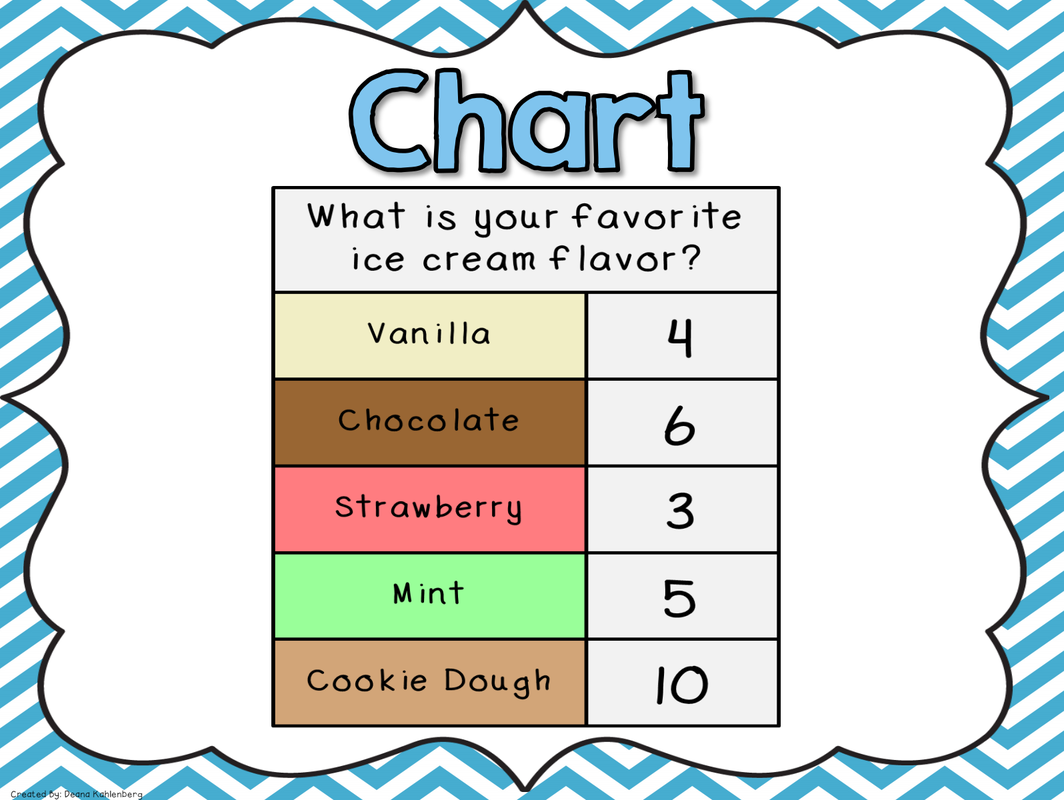
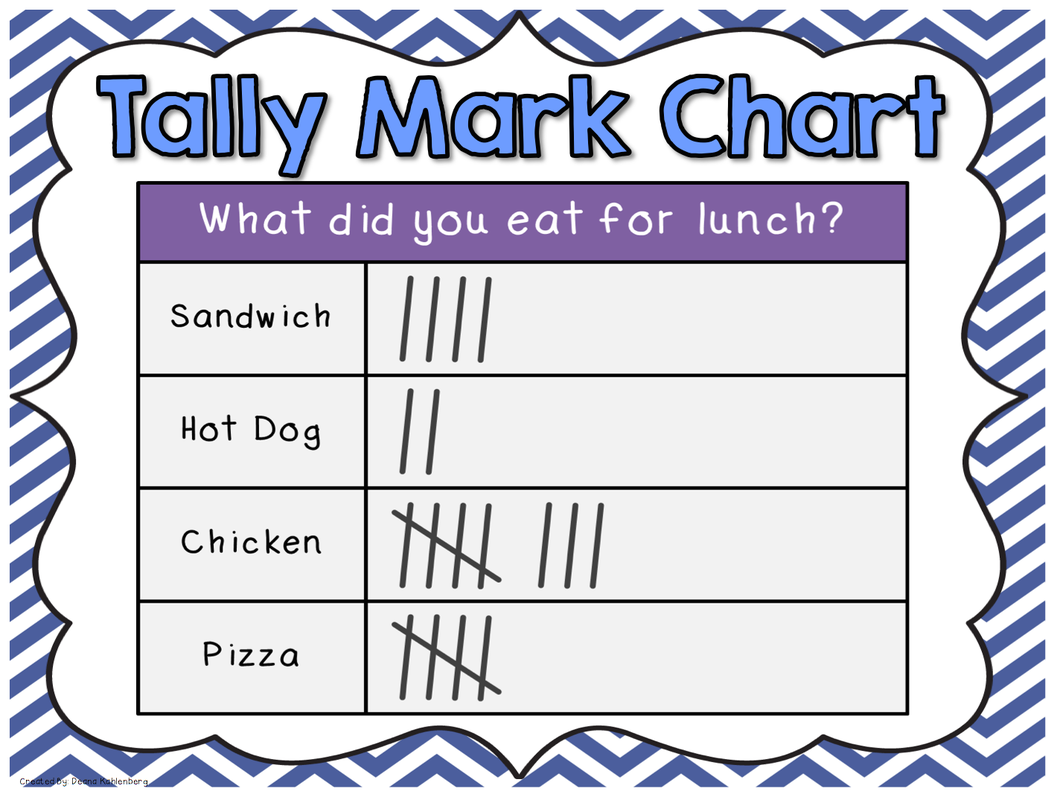
(NB: we often call charts "tables")
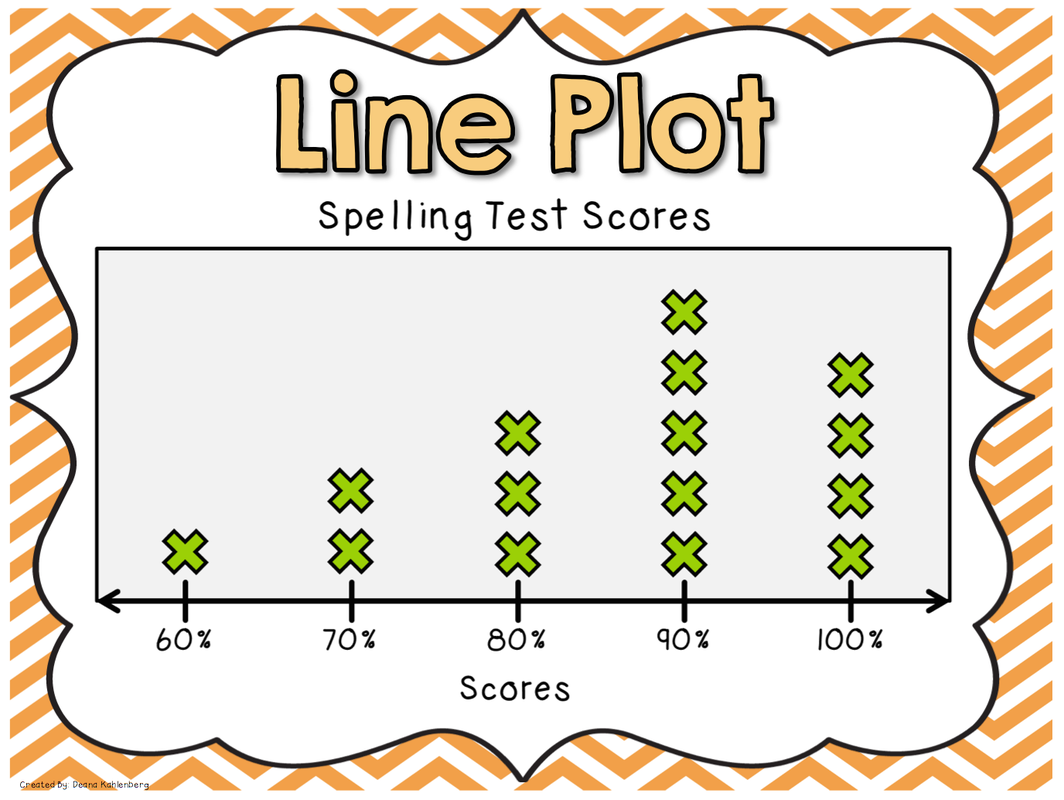

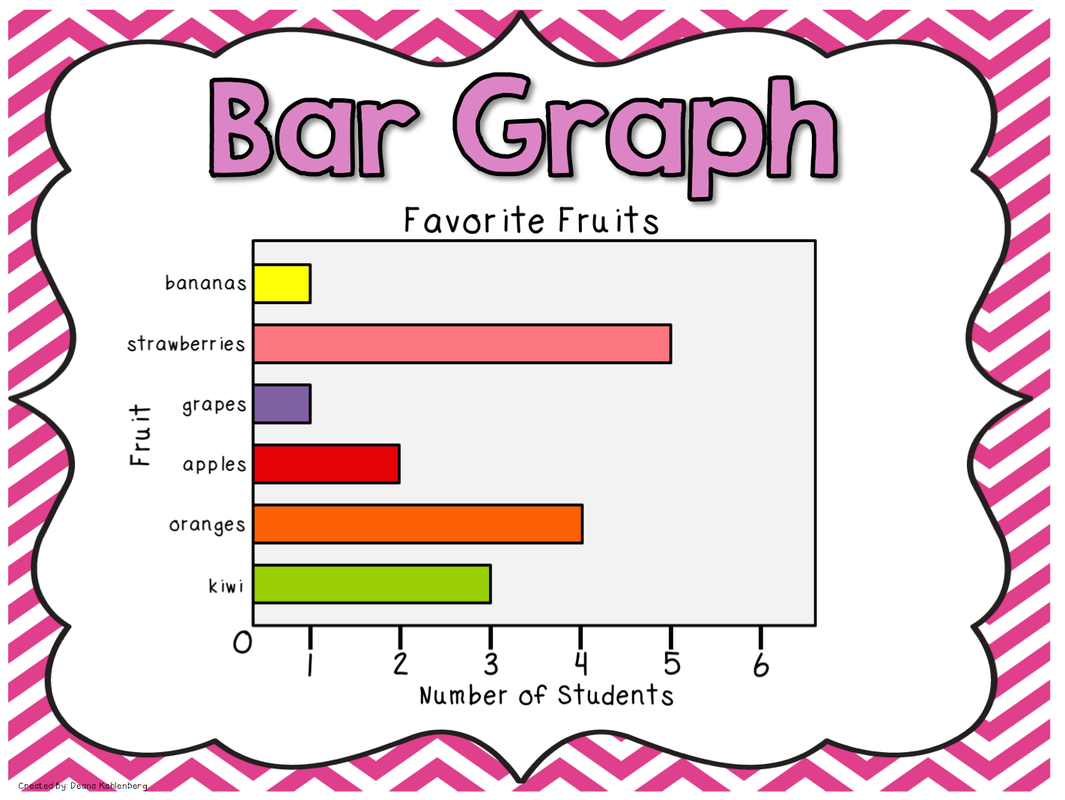
NB: This kind of bar graph can also be called
a column graph. 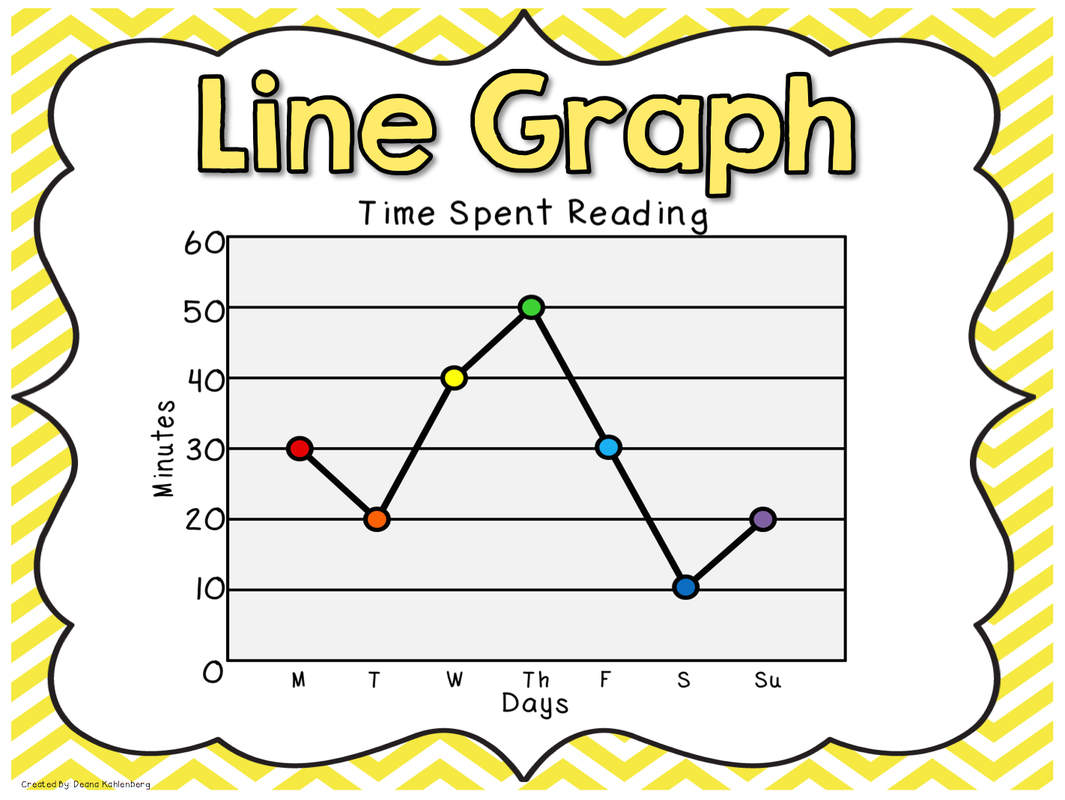
|
|

|
|
Group 1: Tye, Josh, Melissa, Jayden, Indie, Tilli.
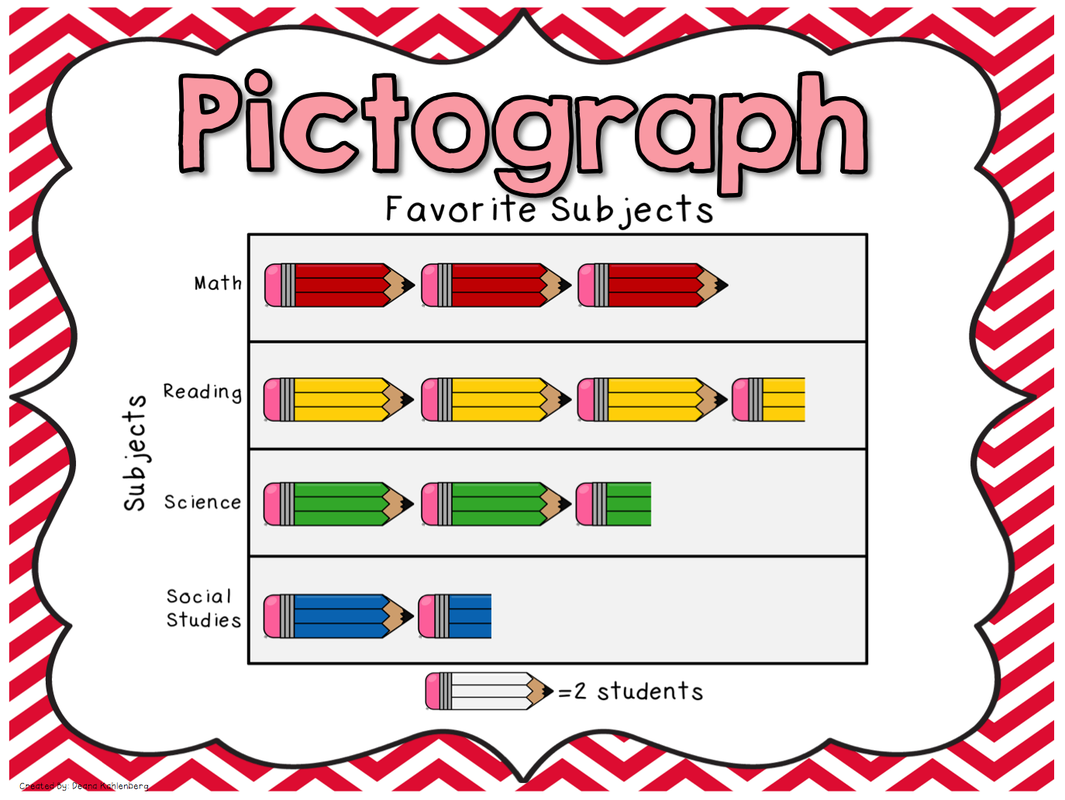
Complete the following task cards & questions about tables, pictographs and bar graphs.
Finished? Maths Online Revision Task - Term 4 Set 5.
Complete the following task cards & questions about tables, pictographs and bar graphs.
Finished? Maths Online Revision Task - Term 4 Set 5.
Group 2: Hannah, Danny, Erika, Emily, Tristan, Grady, Travis, Callum, Jaz, Mackenzie, Felicity, Jaymee.
Complete the following task cards and questions about a variety of graphs including dot plots, line graphs and stem and leaf plots.
Finished? Maths Online Revision Task - Term 4 Set 5.
Complete the following task cards and questions about a variety of graphs including dot plots, line graphs and stem and leaf plots.
Finished? Maths Online Revision Task - Term 4 Set 5.
Group 3: Indigo, Mylea, Navneet, Daniel, Liam, Alysha, Mikaila, Will, Riley.
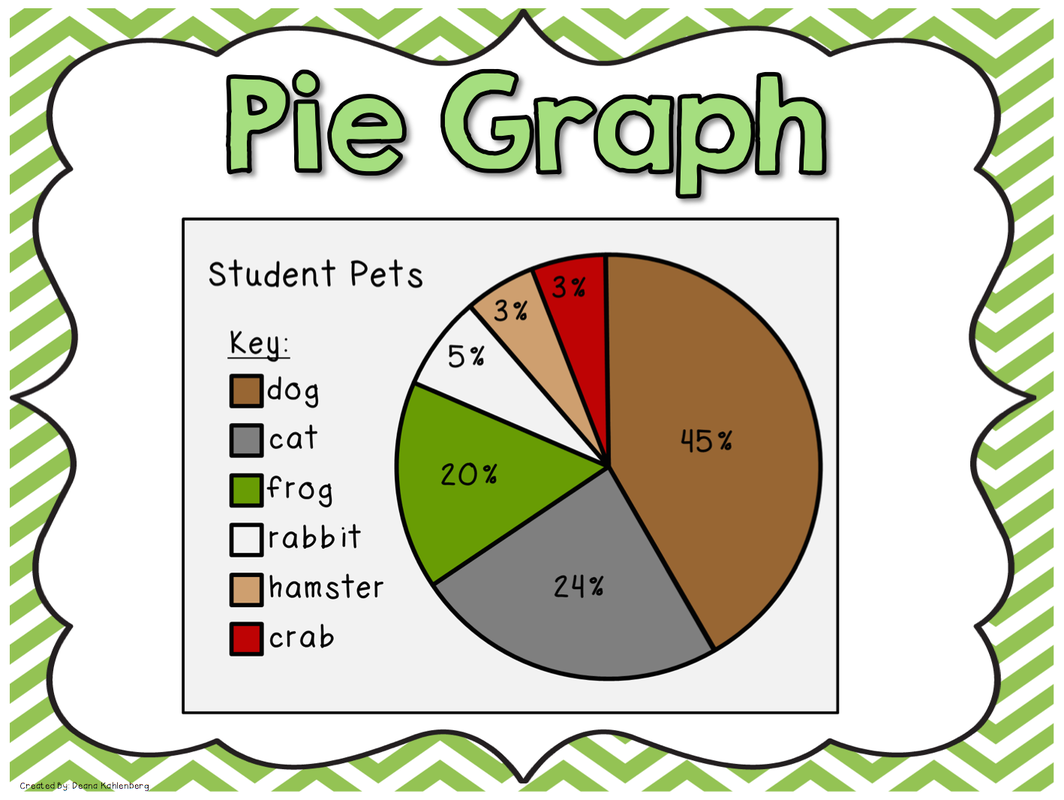
With Miss Brown, work through this investigation of pie charts.
With Miss Brown, work through this investigation of pie charts.
Tuesday 15th November:
Learning Intention: We are designing survey collections to collect data, and constructing data displays appropriate to the type of data collected.
Whole class: Why do we collect data?
You are going to be collecting your own data and use it to eventually create a graph. You may do this on your own or with a partner (both partners need to create the frequency table and graph though). Be sure to make each step neat as it will all be posted on your Weebly!
1. Decide what type of data you would like to collect.
2. Create survey questions to collect the data.
3. Collect data in a frequency table like this:
4. Using resources from yesterday's lesson, decide on the most appropriate type of graph to use to display your data. Read over the information about your type of graph.
5. Create a graph in your grid book to show the data. Make sure you use a ruler and include all the necessary features (title, axis labels etc.)
Finished? Choose a different type of data (that will be suited to a different type of graph!) and repeat the survey, collate and graph process.
5. Create a graph in your grid book to show the data. Make sure you use a ruler and include all the necessary features (title, axis labels etc.)
Finished? Choose a different type of data (that will be suited to a different type of graph!) and repeat the survey, collate and graph process.
Thursday 17th November:
Learning Intention: We are constructing data displays appropriate to the type of data collected.
Today you need to finish graphing your data from yesterday. Once completed, upload the following to your Weebly:
Finished? Investigate how you can create your graph digitally on your iPad or a laptop. Once completed add your digital graph to your Weebly post.
Learning Intention: We are constructing data displays appropriate to the type of data collected.
Today you need to finish graphing your data from yesterday. Once completed, upload the following to your Weebly:
- Survey question.
- Frequency table.
- Completed graph.
- A short reflection explaining the process you went through to create the graph.
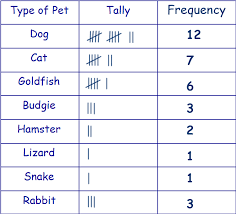
- Three facts that you can read from your graph (eg: From this graph you can see that 13 people in 5/6B have a dog as a pet, whereas only 6 have a cat.)
Finished? Investigate how you can create your graph digitally on your iPad or a laptop. Once completed add your digital graph to your Weebly post.
Monday 21st November:
Sometimes in the media, data may be presented in a certain way in order to manipulate people's opinions. It is ESSENTIAL that we question what we see in the media, and understand how to read graphs accurately. Explore this website together.
Learning Intention: We are constructing a variety of data displays, including all essential features.
Success Criteria: Your graph must include TICALS:

Group 1: Bar Graphs
Group 2: Line Graphs
Group 3: Indigo, Mylea, Navneet, Daniel, Liam, Alysha, Mikaila, Will, Riley.
With a partner or in a group of 3, watch Maths Online Video 3335, then complete these questions:
With a partner or in a group of 3, watch Maths Online Video 3335, then complete these questions:
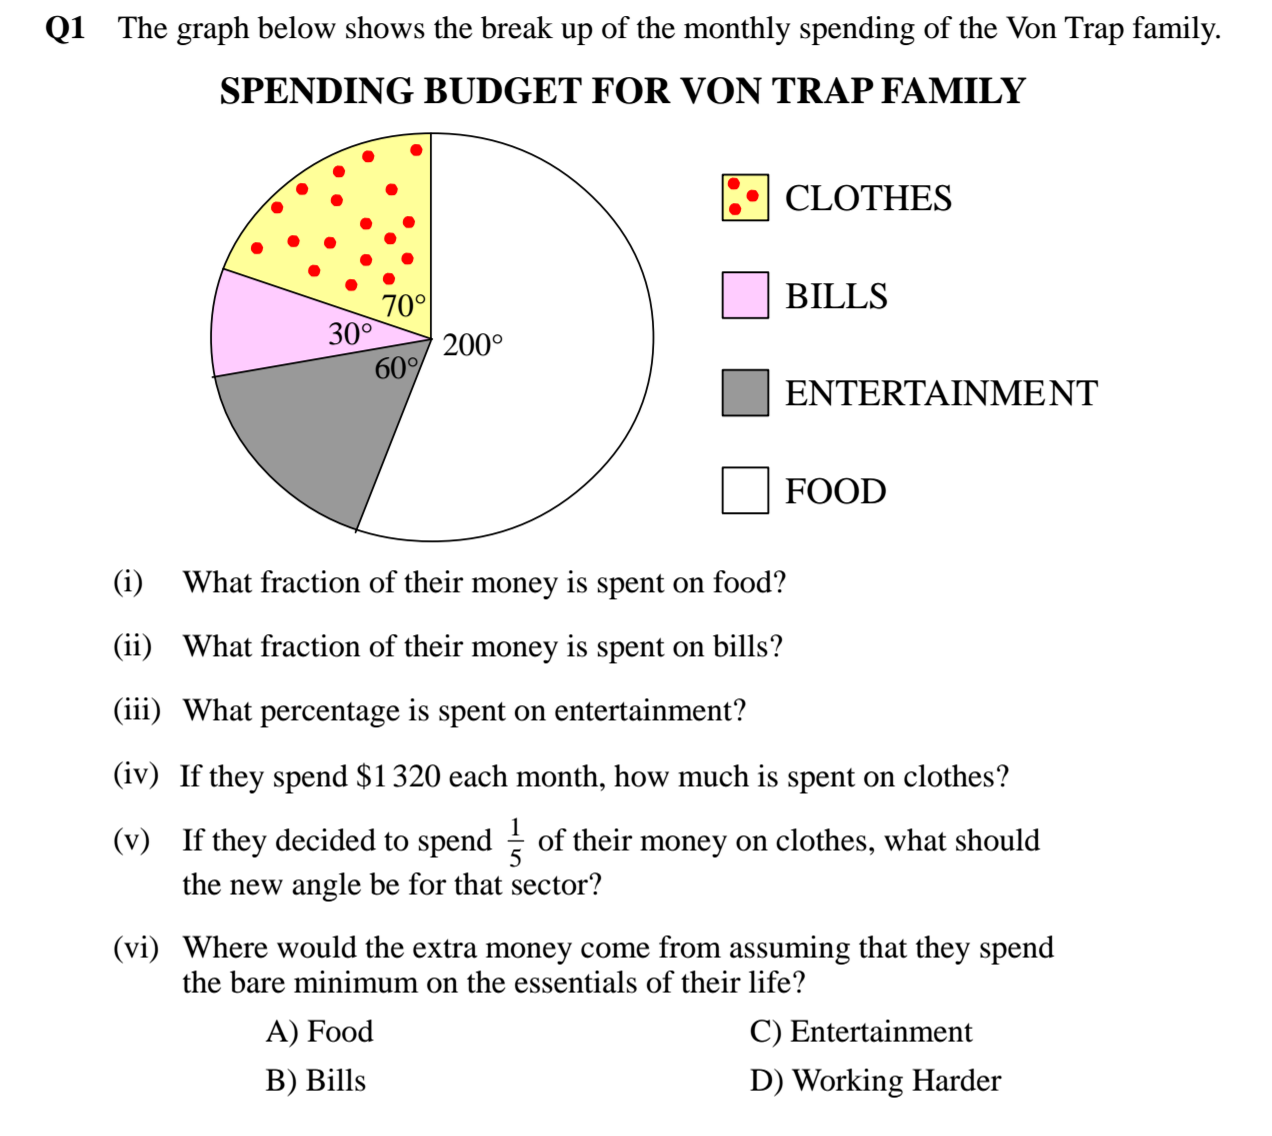
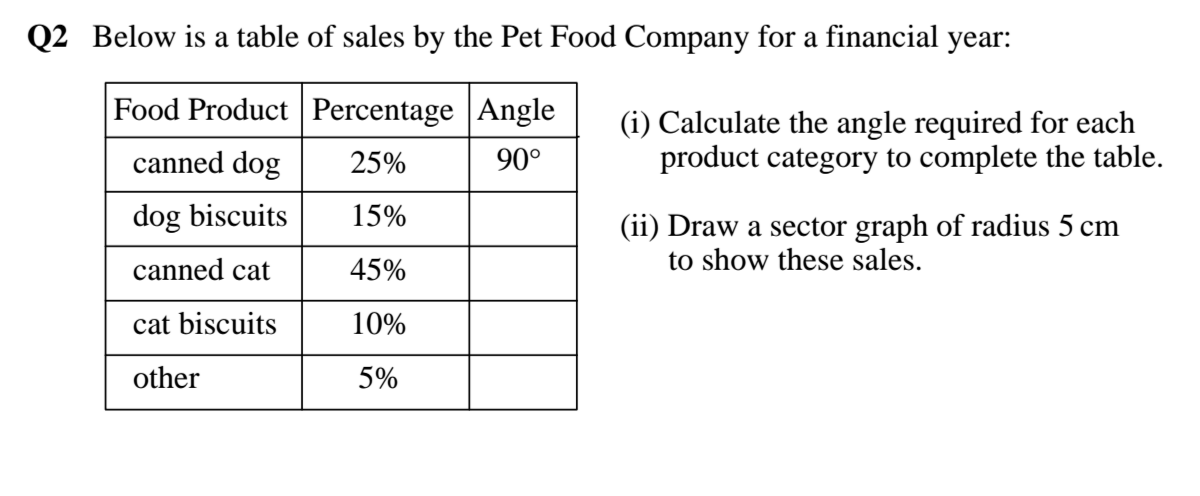
Carefully read through these instructions about creating pie graphs. Work through the questions at the bottom of the website.
Practise making pie charts: Complete the two printed worksheets, using percentages and a protractor to create the pie charts. Make sure they are done neatly! Upload your best one to your Weebly along with a short reflection explaining how you created the pie chart.
Practise making pie charts: Complete the two printed worksheets, using percentages and a protractor to create the pie charts. Make sure they are done neatly! Upload your best one to your Weebly along with a short reflection explaining how you created the pie chart.
Investigating Probability
Wednesday 2nd November
Learning Intention: We are learning to understand vocabulary associated with probability.
Learning Intention: We are learning to understand vocabulary associated with probability.

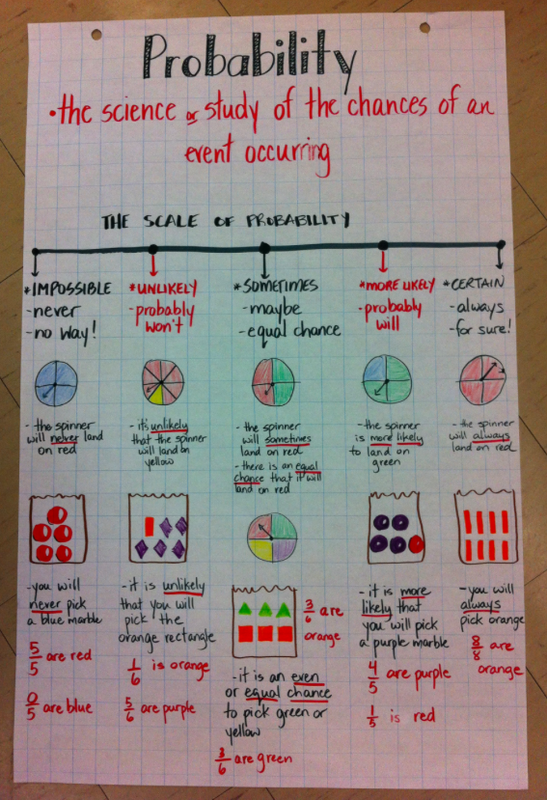
Your task: Using poster paper provided, work together in your co-operative learning group to create a chart of everyday events that are impossible, unlikely, equal chance, likely and certain. You must be able to explain why you placed each event in each column. One or two people from your group will need to be prepared to share with the class.

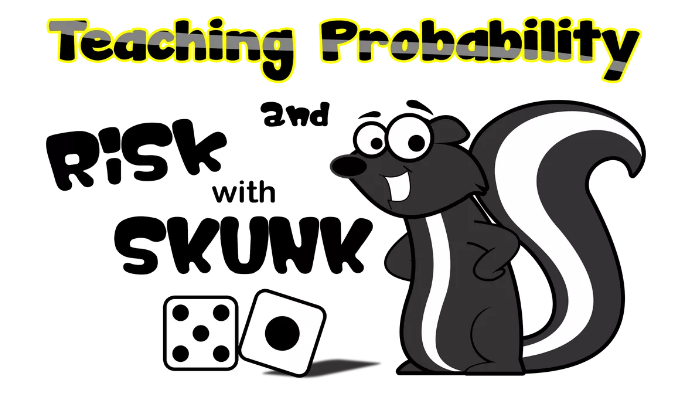
Warm up game: Skunk! Rule up a grid like this one in your Maths Book ready to play.
|

|
Monday 7th November
Learning Intention: We are learning to describe probabilities using fractions, decimals and percentages, and understand that probabilities range from 0 to 1.
Learning Intention: We are learning to describe probabilities using fractions, decimals and percentages, and understand that probabilities range from 0 to 1.

Group 1: Tilli, Melissa, Jayden, Indie, Callum, Josh, Jaz, Felicity, Danny
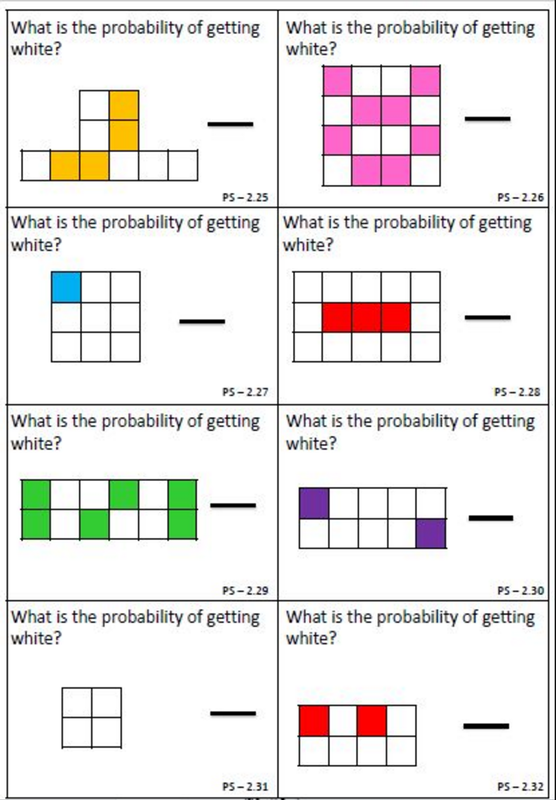
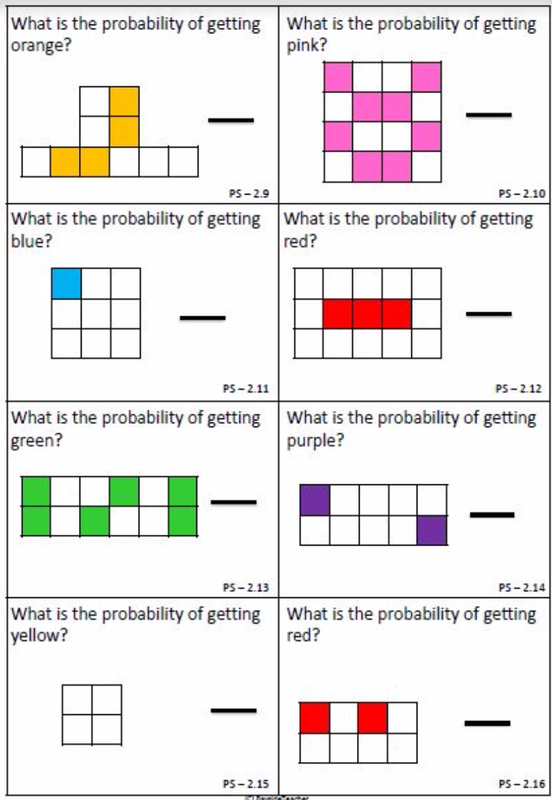
Complete the task cards below, recording each probability as a fraction. When you have completed each task card, write the fraction on your probability number line in your maths book.
Complete the task cards below, recording each probability as a fraction. When you have completed each task card, write the fraction on your probability number line in your maths book.
|
|
Group 2: Tye, Grady, Hannah, Travis, Alysha, Erika, Emily, Mikaila, Jaymee, Tristan, Mackenzie, Daniel, Liam, Riley, Mylea, Navneet, Indigo, Will
Complete the Cards Probability worksheet below, on your iPad. In the 3 blank rows you need to come up with your own probability questions. Finished? Save it to your Maths folder in Google Drive.
Complete the Cards Probability worksheet below, on your iPad. In the 3 blank rows you need to come up with your own probability questions. Finished? Save it to your Maths folder in Google Drive.
Tuesday 8th November:
Learning Intention: We are learning to conduct chance experiments with both small and large numbers of trials.
Learning Intention: We are learning to conduct chance experiments with both small and large numbers of trials.
Whole class: watch this video and discuss!
Group 1:
Coin and Dice Investigation - complete with a partner. (Both partners need to complete the worksheet).
Then: Maths Online Chance Experiments 1560 - watch video and complete questions.
Coin and Dice Investigation - complete with a partner. (Both partners need to complete the worksheet).
- Callum & Travis
- Felicity & Mackenzie
- Till & Hannah
- Melissa & Indie
- Tristan & Josh & Tye
- Danny & Jayden
Then: Maths Online Chance Experiments 1560 - watch video and complete questions.
Group 2: "Fair Spinners" game - play in groups of three:
Group 3:
"Race to the Top" game - play with a partner:
- Liam, Daniel & Grady
- Mylea, Jaymee & Mikaila
- Emily, Erika & Jaz
Group 3:
"Race to the Top" game - play with a partner:
- Indigo & Alysha
- Navneet, Will & Riley
Wednesday 9th November
Learning Intention: We are learning to compare observed frequencies across experiments with expected frequencies.
Learning Intention: We are learning to compare observed frequencies across experiments with expected frequencies.
Win At the Fair!
Play with a partner. Roll two dice, and move your counter that many places in the appropriate direction, as shown on the gameboard.
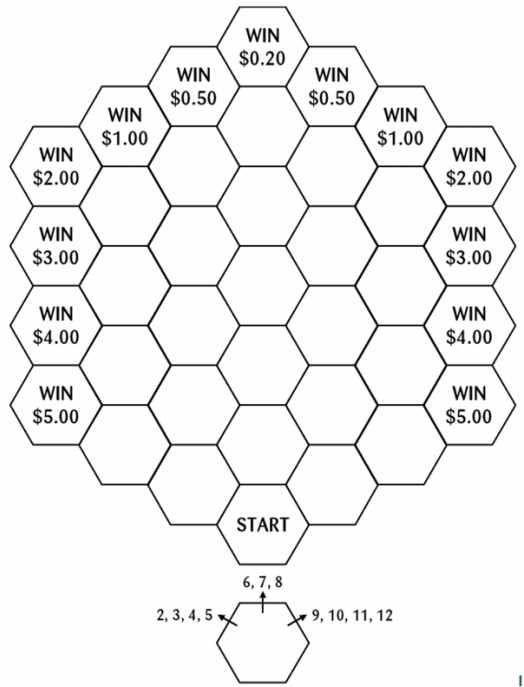
Complete the recording sheet while you play:

After playing, answer the following questions in your Maths Book:
- Which amount did you win most often?
- Which amount has been won most often by all players?
- Which amount is the most likely to win? Why?
- Why do you think the largest prize has been placed where it is?
Thursday 10th November (11:30)
Learning Intention: We are using data to make observations about the game of chance, and evaluate the benefits to the organiser and participants.
Your challenge today: With a partner, create your own "Win at the Fair" game board! You need to use the blank game board but you can change: Cost to play, Direction of Dice and Numbers, and Prize Money.
Success criteria: You need to ensure that the game will allow the school to make the MOST money at the school fair, BUT making sure the game is reasonably fair so that people will want to play! If it is impossible to win no one will want to play so no money will be made!
You need to demonstrate the game a minimum of 5 times (by creating a record sheet and tally) and can re-assess your decisions and make changes as needed so make sure you use PENCIL not PEN.
At the end of this lesson you will all be playing another pair of students' game to test it out and evaluate. Provide feedback using the following prompts:
- I liked that your game…
- I think it was successful because…
- Something I would change is….
- I would or would not play this game because…